Although it is very easy to see the changes since the last
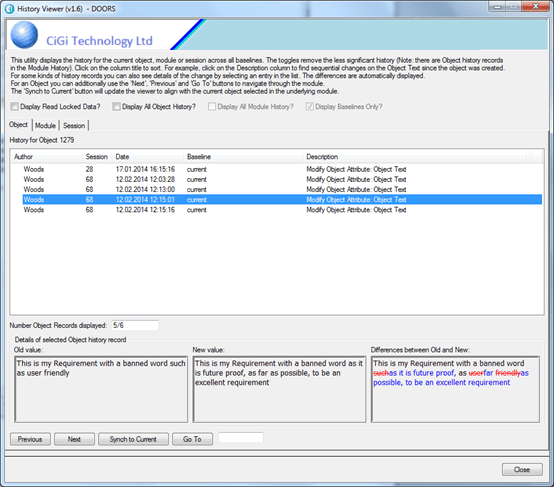
baseline. Paradoxically one of the hardest things to do in DOORS is to find the
history of changes through all baselines. You have to open all the baselines
manually and then go to the right object and then open the properties. And then
sometimes combine them.
And what if you wanted to easily see what was changed, and
by whom, for specific attributes. DOORS
has all the data but how do we get to it?
This very easy-to-use utility solves this problem. It searches through all the history records for all baselines in the module. Once the data has been gathered, then you can then data-mine the results in many different ways, and where possible show the differences in the standard deleted and added Rich Text formats.
The sophisticated navigation functionality allows you to
rapidly move through objects and even synchronise the viewer to the current
object.
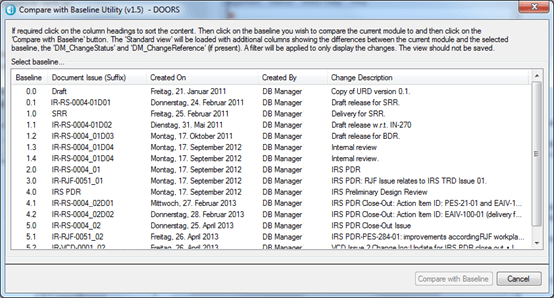
The need to understand the changes between the current
version and the last, or even between any version, is very common. This utility
simplifies this need by displaying all the previous baselines in a module and
allows the user to select a baseline to compare with.
Screen to choose the previous baseline for the comparison
It then produces a view showing the differences to the selected baseline (Note that this image is deliberately fuzzy in order to protect the contents).
Results of comparing the current module with the selected baseline
This
utility will collect metrics from multiple modules rather than just a single
one. The modules within a project are displayed and are then selected manually.
The values collected from the modules are displayed in a text box, separated
with tabs.
The
values can be copied directly into an Excel spreadsheet where they can be analysed
and displayed in a graph or pie chart using Excel tools which are ideal for
management summaries.
The Metrics and Status Tool automatically calculates the traceability,
review and verification status of all the requirements for a specific module.
It’s a great way to direct the user to the work required.
Get Metrics Status Tool
The status is represented as a traffic light system. Each of the view buttons apply a predefined filter to the module to only show the requirements with the specific value. For example, the user can select the View button to display the 315 objects that do not have the necessary traceability in place, so that the links can be added.
The values can also be directly exported to Excel using the Save Metrics button where they can be analysed and displayed in a graph or pie chart using Excel tools which are ideal for management summaries.
The management of modules, copying of views and attributes are all essential tasks for a database administrator and yet there is no in built functionality in DOORS Classic that lets you do these simple tasks.
This
utility brings together all administration type functions. It works both at the
project level – allowing you to manipulate modules – and at the module level
which provides access to attributes and views.
Project Level:
The utility is opened via the DOORS main menu. It automatically
determines the current project folder based on what is open and/or selected but
the user can navigate to any other folder.
It then lists the module names within the project. Selecting a row will display the description and the prefix. The attributes or views in the selected module are also automatically listed. There is a further filter for attributes into normal, DXL or Module attributes.
Double click on the row and the module is opened but you don’t
have to open the module in order to work on it. All operations take place in
Read only mode unless a save is required in which case the utility takes care
of this, checking for locks etc.
The box at the top displays a running display of the success
or failure of any operation.
There are a number of operations that the user can perform
such as loading up a standard set of attributes from an XML file which is great
for pre-populating a module.
The user can also delete attributes or views for a selection of one or more modules at the same time which is extremely useful for making changes to all modules across a project.
The Project Report button produces an Excel report of the
views and attributes for all modules in the project.
Module Administration – Project Level
Module Level:
The same utility also works at the module level where the
user has access to shareable edit, and can manipulate attributes and views. For
example, delete one or more attributes, convert all ticked DXL attributes for
the current module into text or delete one or more views.
Attributes can be copied to other modules (with the relevant checks that they do not already exist in the target module) but perhaps the most useful is the copy view function where a selected view can be copied to one or more modules. This functionality is not easily performed in DOORS Classic.
There is also a button to reset all private views in a selected
module into global access views.
Although DOORS permits the database administrator to set up groups, unfortunately there are no in built report functions that let you understand, for example, which users are in what group, or the permissions a particular user has in a module.
This utility provides the DOORS database administrator with a
series of very comprehensive reports. Most of the reports are simple
text lists, displayed in the text console, with the data separated by tabs so
that it can be directly copied into Excel.
A few of the reports ( marked with an (E) ) are very sophisticated and will export directly into an Excel worksheet including coloured backgrounds for specific functionality. Some of the more important uses are as follows:
Provide a list of the Users for ‘cut and paste’ into excel;
Provide a list of each group and the members in Excel;
If emails have been entered then provide a mailing list;
Extract the RMCDA access permissions for Users, Groups in each Module.
The Excel listing of the groups and the members is worthy of specific mention as it is extremely useful in large projects where there are hundreds of users and groups. Here is an example listing:
An Excel output generated from all Users and Groups within a DOORS database. Groups are listed across the top and there is a row for each user. Details of the user are listed and ‘X’ identifies whenever a user is in a group.