The Requirement Editor and Viewer utility is designed to show the relationship between 2 levels of Requirement (Level N and Level N-1). Depending on the client set up, the links can be customised so that the order of the N-1 requirements can be changed so that they follow a logical progression, or a particular scenario. This tool has proved to be of immense value in presenting requirements to a review panel or the client for formal endorsement.
DOORS is particularly valuable for Progressive Assurance and for demonstrating that a requirement has been fully verified and validated. As well as showing the relationship between requirements at different levels, it is possible to link Test Results and other forms of verification evidence to all level of requirements via ‘Verification Goals’. A Verification Goal is essentially how you are going to prove that the requirement has been met. Typical outputs from the Verification Goal modules will include the Verification and Qualification Plans and Verification Cross Reference Matrices (VCRM). Note different companies will use different terminology but the principles will be the same.
The tool has been designed as both an editor (and therefore only presenting to the user those fields that can be modified) and as a viewer. These are fully integrated so that it is possible to navigate to a particular requirement in the current module using the tool, then view and/or edit attributes and then switch to the viewer to see the impact of making any changes. Either the lower level requirement or the verification attributes can be shown by a click of a button.
Requirement Editor utility
The user will be able to add or remove links from lower level requirements by the use of a search popup that interrogates the lower level module structure.
Another feature lacking in classic DOORS is to show the interrelationships between levels of requirements.
Working in conjunction with the requirement editor, CiGi Technology have produced this viewer that shows how requirements at a lower level satisfy the upper level requirement which is the subject of interest. The user can easily switch from Editor to Viewer and back again.
Example of a Requirement Traceability view
The lower level requirements are shown together with the type of relationship in the traceability from the lower level. Also displayed is the requirement ID and the heading above each requirement. This view is particularly useful for navigation around the requirements.
Either the lower level requirement or the verification goals can be viewed by a click of a button.
Goal Structuring Notation (GSN) is used in a hazard analysis
or during the production of a safety case for systems that can cause hazards.
This could be in those industries where safety assurance is critical such as defence, automotive, rail or nuclear
sectors.
It is a graphical notation for representing the structure of
safety arguments. It is effectively a pyramid structure with a bottom layer of
evidence. The higher levels are built upon the lower levels until the argument demonstrates how
the set of evidence items combine together to demonstrate the top claim (e.g.
that the system is acceptably safe to operate in a particular operating
environment).
Although the safety case is built bottom up, in reality the
argument is a top down approach. The principal purpose of a goal structure is to show how goals (claims
about the system) are successively broken down into (“solved by”) sub-goals
until a point is reached where claims can be supported by direct reference to
available evidence (solutions).
By
using GSN in developing a safety or environmental case, you will be introducing
a confidence in the stated claims that is hard to establish by other means.
What is GSN?
Goal Structuring Notation is a graphical argumentation notation that can be used to explicitly represent the individual elements of any complex argument, based on visualization of evidence. Because it is graphical it provides a clear way of forming, and navigating, often complex arguments. The GSN diagrams are often supported by the inclusion of further textual narrative to find the right balance between brevity in the diagrams and a fuller explanation provided by the additional narrative.
The argument is levelled with a top level claim about the level
of risk (Goal 1).
Through use of an organised argument using GSN notation, the
top level claim is decomposed into lower level claims and strategies
(constituting the argument). e.g. Goals G.1.1, G1.1.1 …, Strategy S.3 etc.
The low level claims are ultimately satisfied by references
to evidence, in this example through a reference to an appropriate set of
functional requirements, safety cases and test evidence e.g. E1, E2, E3.
In simple terms, the process to produce the safety argument can be summarised in a number of steps as (this is a guide and is not mandated):
Clearly define the objective and scope of the safety argument being presented;
Define the basis for the goals – e.g. context information;
Identify strategy- i.e. how to substantiate the stated goal;
Define the basis for the strategy – as for a goal, identify any relevant contextual information;
Elaborate the strategy, defining the sub goals;
Identify solutions; and
Review and assess the GSN against qualitative review criteria such as completeness, correctness, adequacy.
GSN Symbols
Example of a GSN diagram created using Visio
Example of a GSN diagram using colours to represent maturity
In this example, the following colours have been assigned to demonstrate maturity: Blue Unassigned Red Basis has been agreed Amber Work in progress Green Work complete
The maturity is inherited from the lower level elements
according to a series of predefined rules taking into account the worst case.
For each symbol there is a ‘traffic light’ system to convey maturity. Once engineers become familiar with the GSN notation, then this aids a speedy assessment of the overall safety argument goals and strategies and their maturity and should also identify where any additional effort should be focused to resolve any specific issues identified.
Although GSN diagrams can be produced with drawing tools such as Visio or even PowerPoint the amount of information is unfortunately fixed to what is in the diagram and this may not be sufficient for a safety case.
DOORS will provide an elegant and rich GSN.
Example of how it can be done in DOORS
The user could edit the values directly in DOORS. But the aim of this tool is to present the safety argument in a clear and concise manner without the need to have any knowledge of how DOORS works or is modified.
The following two examples provide an extract of Goal Structuring Notation (GSN) relating to:
The safety argument around Hazardous RF Emissions for an aircraft.
The Automotive Safety Integrity Level (ASIL) which is a risk classification scheme defined by the ISO 26262 – Functional Safety for Road Vehicles standard.
In both examples, the GSN Hazard Log Editor and Viewer are built from a series of editors which combine together to inform the GSN display itself. The display and the editors are intrinsically linked so that edits are immediately reflected in the display. The edits are only permanent if the user saves to the underlying DOORS module(s).
The Hazard Editor for an Aerospace Project
Selection of an Aerospace Hazard
This is the main page and is used to add, delete, view, and edit an aerospace hazard. There can be any number of hazards within a project and each hazard is in its own module. The hazard editor searches through the current project identifying the hazard modules. Attributes such as the description and overall status are displayed to identify the hazard if the names are similar.
Once the hazard is selected then the user can either edit more
of the hazard attributes such as operating states or the Hazard Inherent Risk
matrix values.
Top level aerospace hazard editor
Each hazard is allocated a classification according to a
severity and probability matrix which is then used to automatically calculate
the inherent and residual risk.
Frequency (likelihood) and Severity (consequence) hazard table with Risk rating
The table used in the example is a 4 * 6 matrix, but the software can be modified to any table size. The software could also be further expanded to provide ALARP statements, links to cause and consequence mitigations, or provide links to Safety requirements to form a progressive assurance regime.
Alternatively, the user can go directly to the GSN display.
The Hazard Editor for an ASIL Project
Selection of an ASIL Hazard
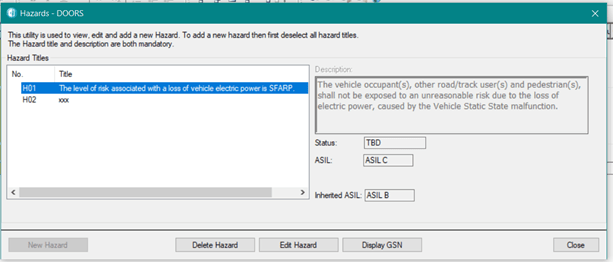
This is the main page for an automotive project hazard and is used to add, delete, view, and edit an ASIL hazard. As with the aerospace format, there can be any number of hazards within a project and each hazard is in its own module. The hazard editor searches through the current project identifying the hazard modules. Attributes such as the description and overall status are displayed to identify the hazard if the names are similar.
Once the hazard is selected then the user can either edit more of the hazard attributes such as ASIL level and inherited ASIL level.
Top level ASIL hazard editor
The Display
Both editor formats use the same GSN display. The GSN symbols are displayed according to the type, location, relationship and maturity. As the levels zoom in (using the GSN display control panel) then the amount of information displayed is automatically decreased. Vertical and horizontal scroll bars can be used to move the centre of interest.
As the user zooms out then the information level increases.
The scroll bars are automatically resized with the level of the zoom.
Symbols can be selected using the right hand button. Multiple
symbols can be added to the selection using cntrl + right hand mouse button
click. Element(s) can be moved by selecting the element(s) and then pointing to
the desired location using the left hand mouse button click. A popup is used to
confirm the move.
The GSN display has its own dedicated control panel which can define automatic or manual placement of each element and a zoom factor. Because we are using the DOORS canvas then, unfortunately, we don’t have the luxury of drag and drop that you would expect with modern editors. However, by using the mouse buttons then a user can select a target location and then move one or more objects. This is a quick way of moving blocks of elements. Then each element (or a group if required) can be moved a small distance using the nudge features. Groups of elements can also be aligned horizontally or vertically. The traceability relationships are automatically moved along with the elements. The user also has access to the x, y co-ordinates in the element editor for very fine granularity changes.
When zooming then the amount of text displayed in each
symbol is truncated to remain within the symbol. By swapping between the
display and the editor, further textual narrative to support the GSN diagrams can
be added to find the right balance between brevity (in the diagrams) and a
fuller explanation (provided by additional narrative in the editor).
The display can be cut and pasted using traditional snipping tools or via Paint but the tool also provide the ability to export to xml or html.
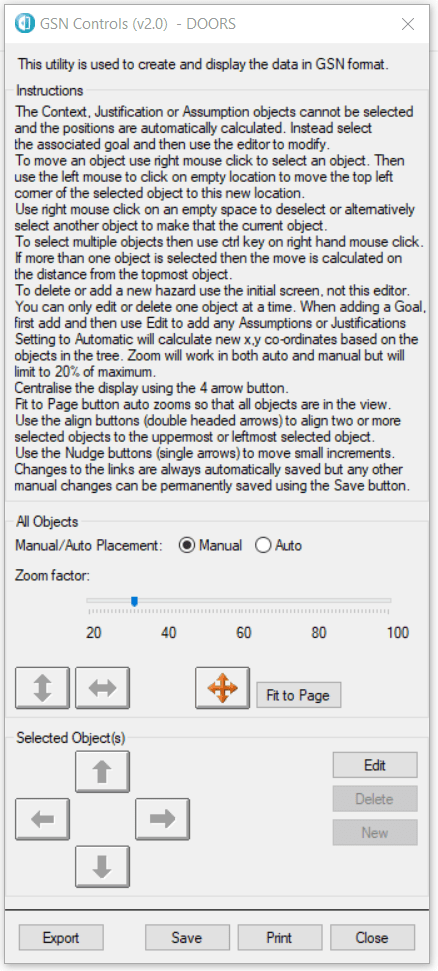
Display controller
Both manual and automatic placement options are available. It is recommended to use the automatic placement and then swap to manual placement for fine tuning and aesthetic preferences. Also provided are buttons to centralize the display and fit the diagram on the page (by automatically calculating the zoom factor). There are buttons to align horizontally and vertically, or nudge in any direction a selection of elements. The buttons are enabled and disabled depending on the elements selected.
If an object is selected, then the element editor can be called via the Edit button.
The Element Editor
The editor is used to create or modify an existing element. If the selected object is a hazard, then the maturity and location is based on the underlying Goal. The maturity is normally assigned according to the child objects although it is possible to override. Assumptions, justifications and context elements can be added. The element editor is context sensitive and will display the appropriate editor for the element being modified. The element editor also provides the manual selection of the x, y coordinates.
This utility counts the number of projects, modules and objects in the entire database. It is a simple script that is either run from a menu or loaded into the database DXL interaction window
There is a Boolean constant in the code that, if set, will print out the names of the folders and modules being searched. This is useful for debugging and for looking to see where any DXL attribute errors are located (if present, then these will be made visible when the module is opened by the script).
It doesn’t use recursion to delve down through the database structure but uses the itemRef in a ‘for’ loop through each project. This means that the order will be different to the hierarchy but since we are only interested in counts then that’s not a problem.
It will exclude deleted objects, deleted modules and deleted projects. The results are displayed in the DXL interaction window.
Global Metric Count Tool – DXL Interaction window output
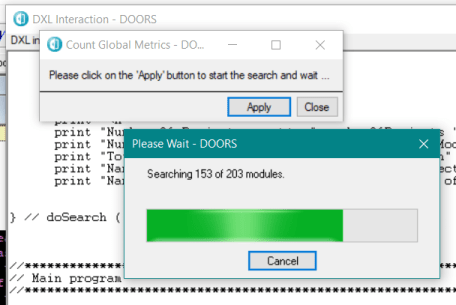
The script opens up every module in the database so it can take a long time. A progress bar is therefore used to display the current position in searching through the database.
Gblobal Metric Count tool – Progress Bar
But perhaps the most significant aspect of this tool is that it can be easily adapted to collect other information as it parses its way through the projects and modules.
It is common to use colours to highlight specific values. This can be undertaken using the inbuilt features of DOORS to colour the text or the background based on the colour of an attribute enumeration. However, this has limitation in that it is sometimes difficult to read the text when in read only, and that only one colour can be used at a time.
The RAG metrics technique (and it is not limited to just Red, Amber and Green) can be used to set the colour of a layout DXL column based on keywords that are contained within the target text attribute. Any number of columns can be set up that will reflect any combination. It is a simple matter of editing the script.
This is a more sophisticated display of a percentage bar for multiple metrics for multiple modules. It uses a specific module that can be located anywhere in a project and that has just two views. There are two DXL scripts associated with this module. One is an attribute DXL script which contains functions to locate the target modules of interest, calculate the metrics and write the values back to the module; the second script contains layout DXL functions to read and parse the value entries and display the results as a list column and as a percentage bar.
Metric View: This view consists of four columns. The first column is a free format description of the metric. It takes no part in the metric determination. The second column displays a box, the percentage value, the actual count and the name for each enumeration to be counted. Note that the percentage total value may not be 100% as the individual values are rounded to the nearest integer and then totalled. The third column displays the same information but as a percentage bar. If the width of this column is changed then the percentage bar is automatically resized. The name of the attribute enumeration is only displayed within the bar if there is sufficient room to show the whole name. The final column displays the date and time when the DXL used to calculate the metrics was last run.
Metrics View
Metric Values: The entries within the columns within this view determine the metric itself. The first column is simply the Object Identifier. The second column, as in the Metric View, is the free format metric description from the Metric View. The next column determines whether the metric should be based on enumeration values in the target module or as a filtered count. The next column contains the full path of the module to be searched. If a project name (rather than a module name) is used, then the script will search all the modules in the project. If this option is selected, then the modules will need to have the same attribute enumerations. If a view name is added into the next column (it is optional and can be left blank), then this view is loaded and if the view has a filter then this constrains the values of the enumerations.
The attribute name column contains the name of the attribute that the enumeration values will be derived from. This is automatically extracted from the target module. The next column identifies the colours to be used for each enumeration. These can be set to any colour from the standard list of real colours. If there are insufficient colours defined, then the enumeration will be displayed as pale blue (which has an integer value of 0).
The next column displays the values from the DXL script that performs the search and calculations. The format is described below. The final column, as the metric view has the date and time of when the script is run.
Metric Values
These are the metrics as run on the Stakeholder Requirements module in the Car Project, with a filtered view “Requirements” applied and the System Requirements module with no view applied.
Note that the values in the Value column have a specific format and should not be changed as the entries are all calculated by the DXL script:
value,colour,B|W:count
value : name of the enumeration colour : the integer value of the colour in the colour map B|W : text colour (Black or White) count : the actual number of counts of the enumeration in the target module(s)
In almost every project I have worked on there is a need to
export the requirement set into Word as a requirement specification and get it reviewed,
approved and distributed. And in a lot of cases that is how the requirements
arrive; as a requirement specification that has to be imported into DOORS.
When importing or exporting then the front pages of the Word
document are not part of the requirements – or at least they should not be. The
requirements module should only contain the requirements and not the front matter.
Where does all that information go? You also need to correlate the document
versions with the module/project baselines. So how is this done?
The contents/index can be easily generated in Word but maintaining
the version history, the reviewer and the distribution data is not so easy. Yes,
you could put this in as ‘Information’ in embedded tables at the front of the
requirements, but this is messy to edit. You could even have a separate module
for the data and link it in on the build. But this makes life more complicated.
By far the simplest way is to store this information as module attributes. Clearly a DXL utility to extract, display and edit these module attributes is going to be extremely useful.
Document Manager DXL utility
This DXL Utility is extremely comprehensive and has been
designed to manage all aspects of document management from within DOORS ranging
from document issue, performing baselines and export to PDF.
Firstly, you select the document number- as this tool allows
different documents to be exported from the same requirement module – so you
could export a requirement specification, a VVRM matrix ( pulling in linked
data from the test cases and even test results) and an interface specification (
filtered on interface requirements). Then select the version or issue of the
document (as matched with the module baselines). What is then displayed is the document
title, additional document information (which can be tailored for your
company), the names of the document signatories and the document distribution
record. Often this information is the same for each document and version, but
it can be modified for any combination.
Depending on the user group access then these fields can be either
read only or editable (in the former case the Edit button is disabled). They
can also be locked down if a document is published.
What is also displayed in the lower part of the screen is
the document change history and a series of buttons.
The buttons allow the creation of a new document (which is
how the module can used for multiple documents as described above), creation of
a new issue by execution of a new baseline (major or minor), or the generation
of a pdf. This latter operation is an export using LaTex functionality and it
will use all of the information above, plus a predefined company/document
template containing the company headers and footers to build the complete
document. As an alternative this could be linked to Rational Publishing Engine.
Before the document is produced the user can also enter the pdf
file name and location and whether change bars are required.
The Working Copy entry is for when a document is needed to
be exported for review but not as a formal issue. In which case the document is
water marked as Draft or For Information Only.
It is very common practice to introduce a hierarchical breakdown of a project according to the products or systems. This is known either as a Product Breakdown Structure (PBS) or System Breakdown Structure (SBS). There are a number of ways to introduce this into the DOORS database. You could use an attribute in every module with an enumerated list containing all the PBS values. The disadvantage of this approach is that when you have to make a change to the list (and this is more common than people think) then the type has to be changed in every module. Whilst this is easy to achieve using the Module Administration tool (see Module Administration utility), the second disadvantage is that you cannot actually see a hierarchy in a flat list of elements. You also cannot see a combined list for all modules. So, if you wanted to see requirements allocated to System X then you would have to search all modules and somehow collate the results together.
A more effective approach is to build a PBS into a standalone module. This has a number of advantages:
The
hierarchy is immediately obvious;
The
list can be easily changed;
The
item can have additional attributes such as a description;
By
linking requirements to items in the PBS it is possible to display the values
as a DXL attribute; and
Most
importantly, by viewing the requirements from the perspective of the PBS you
can see the impact of making a change to the PBS– before making the change. Impact
analysis is greatly enhanced.
The principle can
be adopted for any hierarchical list. For example, hazards can be broken down
into causes.
The same principle for a PBS can be applied to a
Verification Breakdown Structure (VBS). In fact, using DOORS as a relational
database, it can be applied to any form of enumeration (Organisation Breakdown
Structure (OBS) or Work Breakdown Structure (WBS) although over-use can result
in spaghetti-like links.
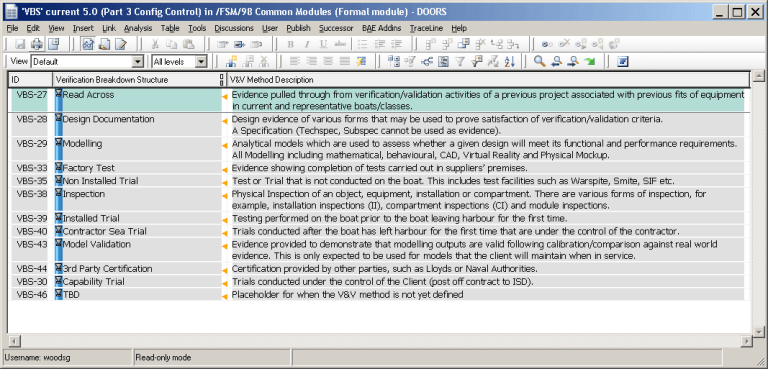
The Verification Methods would be defined in the Verification Breakdown
Structure, or its equivalent, and therefore it is very easy to identify all
requirements that will be affected by a single Verification Method by looking
at all the links from the VBS module. This permits the use of multiple
Verification Goal modules structuring and ordering the Verification activities
according to operational rather than functional needs. This approach makes the
generation of the Test Procedures/Test Schedules very controlled as the modules
provide the framework.
Another point to note is that there should always be a
strict data model enforced within the database with reserved words for the link
relationships. More details on how CiGi Technology can help you produce a data
model can be found in Consultancy
Services.
Example VBS
DXL
Attributes can be used to show the results of the link.
It is commonplace to see in a requirement statement the
phrase “in accordance with xxx” where
xxx is the title of a reference or “ … in accordance with Reference nnn” where
nnn is a unique number assigned to a reference. How is this managed in DOORS so
that the references are controlled and that any change is propagated through
the whole of the project?
In particular, it is very important to know the issue or version referenced from a requirement as any change in content may significantly affect a requirement and initiate an impact analysis (that determines what would be the impact of changing a reference). Unfortunately, there is nothing readily available in DOORS Classic that can help.
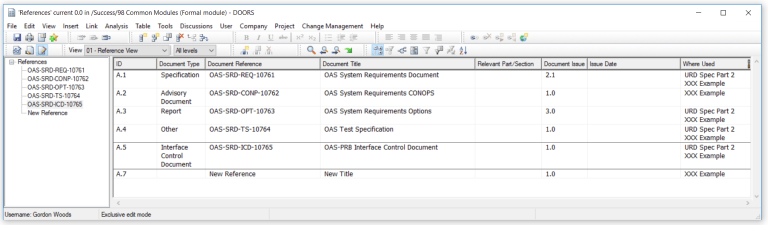
However, what we can do is to build a reference or evidence
list.
A reference list
would contain all the documents that are referenced by the requirements. As
well as the mandatory attributes such as the document reference number, title
and version/issue we could add additional information such as the document
type, who authored the document and when it was issued.
Example References
The question of what requirements would be affected can be
automated using DXL to provide the identification of where it is used. Thereby
considerably reducing the amount of time that the management of external and internal
referenced documents would take for an organisation.
An evidence list has similar properties but it is used to
identify documents external to DOORS that are used in the evidence trail. For
example, Standard Operating Procedures, Test Cases, Test Reports etc.
Example Evidence List
Additional attributes may include Verification or Validation identification and external hyperlinks to a document repository. The important thing to note is that the traceability from evidence to the requirements is continuous.
In these examples we are using an internal repository module/table. We could have alternatively used direct traceability links such as provided by Open Services for Lifecycle Collaboration (OSLC). Support on OSLC synchronisation to external document repositories such as Aconex, Documentum or TeamBinder is also available.
It is extremely useful if Abbreviations are defined either
at the Company or at the project level. This will prevent misunderstanding if
the same abbreviation has different meanings on different projects.
An example of this
could be ‘PBIT’ which could mean either “Power up BIT” or “Periodic BIT”. A
misunderstanding in the use of this term between teams could lead to totally
different functionality resulting in significant interface issues and rework.
Example Abbreviations
In this type of
implementation then a sophisticated DXL Attribute is used to display the ‘Where
Used’ values – there are no links involved.
It is interesting to note that this functionality is already
available in DOORS Next.
A data repository is always needed because words can have
different meanings in different contexts. They also can be highly specific:
Identification – A user (person or
system) must supply an identifier and/or the system must in turn supply an
identifier to the user so that the user knows that he is accessing the right
system.
Authentication – The identity of the user must be authenticated (i.e.,
verified so that we know that the user is who/what the identifier is associated
with). That is, authentication is the verification of the identity assigned
during Identification.
Authorization – Once a user has been identified and
the user’s identity has been authenticated, the user can use the services and
access the data that the user is authorized to use and
access. This can be done by membership in a group or done on an individual
identifier basis.
Use of italics and/or Capitalisation of a word is
often used as a means of indicating a glossary item, so that it is clear to the
reader that it is not just a word in a sentence, but it has a defined meaning.
A parser can now check the specification for undefined terms.
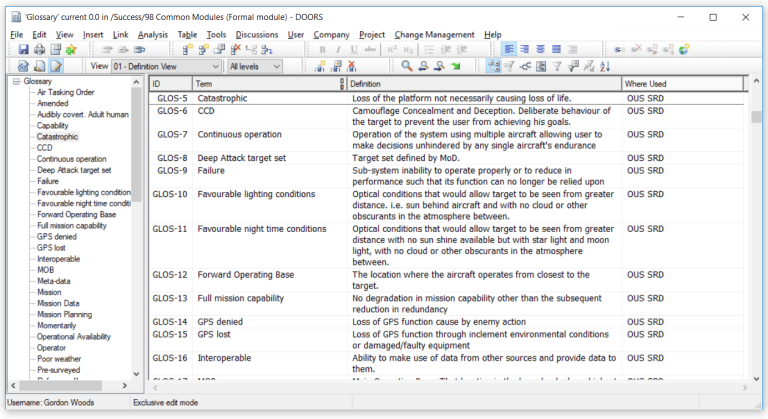
A glossary in a requirements specification, and which is
project wide, is absolutely essential as it provides the precise definition of all
terms.
Example Glossary
In this type of implementation then DXL Attributes are used to display the ‘Where Used’ values – there are no links involved. As with the Abbreviation terms, then this functionality is already available in DOORS Next.
For information on a DXL Script that pulls all these features together then click here.
Although it is very easy to see the changes since the last
baseline. Paradoxically one of the hardest things to do in DOORS is to find the
history of changes through all baselines. You have to open all the baselines
manually and then go to the right object and then open the properties. And then
sometimes combine them.
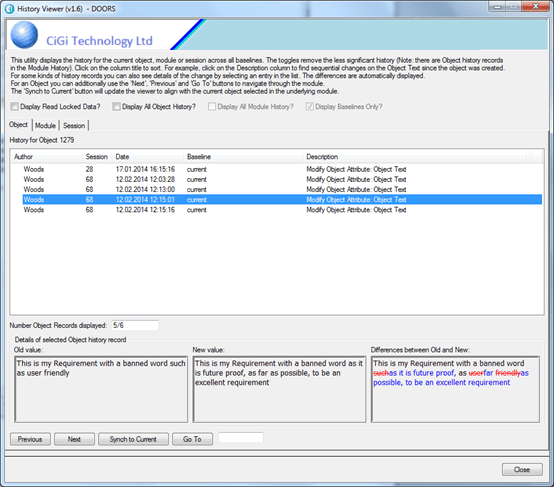
And what if you wanted to easily see what was changed, and
by whom, for specific attributes. DOORS
has all the data but how do we get to it?
This very easy-to-use utility solves this problem. It searches through all the history records for all baselines in the module. Once the data has been gathered, then you can then data-mine the results in many different ways, and where possible show the differences in the standard deleted and added Rich Text formats.
The sophisticated navigation functionality allows you to
rapidly move through objects and even synchronise the viewer to the current
object.
This
utility will collect metrics from multiple modules rather than just a single
one. The modules within a project are displayed and are then selected manually.
The values collected from the modules are displayed in a text box, separated
with tabs.
The
values can be copied directly into an Excel spreadsheet where they can be analysed
and displayed in a graph or pie chart using Excel tools which are ideal for
management summaries.
The Metrics and Status Tool automatically calculates the traceability,
review and verification status of all the requirements for a specific module.
It’s a great way to direct the user to the work required.
Get Metrics Status Tool
The status is represented as a traffic light system. Each of the view buttons apply a predefined filter to the module to only show the requirements with the specific value. For example, the user can select the View button to display the 315 objects that do not have the necessary traceability in place, so that the links can be added.
The values can also be directly exported to Excel using the Save Metrics button where they can be analysed and displayed in a graph or pie chart using Excel tools which are ideal for management summaries.