One of the little known facts is that DOORS keeps a record of login and logouts of each user. The file is a text file and is readable by any text editor, but it is much more useful if the entries can be parsed and analysed in order to provide the last login for each user.
When the data is merged with the user list it then becomes clear, as an example, who has had a licence but hasn’t used DOORS in a while. This utility is therefore great for tidying up users who are effectively dormant and can be ‘disabled’ (using DOORS terminology).
The first task is to locate the ‘login_history.txt’ file which is embedded deep within the DOORS file structures. Because the location can depend on the DOORS version the user will browse using the standard mini explorer and the guidance provided.
Once the file is identified and opened, then the utility will automatically parse the login history file.
Parse Login History
There are options to merge with the User List which will include users that are defined but who have never logged on since the search criteria date). Other options are to show disable users only and to select the ‘date from’ (which will reduce the parse time on large projects). If any of the options are selected, then there is a ‘Get Login Data’ button to redo the parse.
If required, then the resulting list displayed in the main window can be exported to a csv file. The file location for this output file can be either browsed or typed directly into the file location area.
This utility counts the number of projects, modules and objects in the entire database. It is a simple script that is either run from a menu or loaded into the database DXL interaction window
There is a Boolean constant in the code that, if set, will print out the names of the folders and modules being searched. This is useful for debugging and for looking to see where any DXL attribute errors are located (if present, then these will be made visible when the module is opened by the script).
It doesn’t use recursion to delve down through the database structure but uses the itemRef in a ‘for’ loop through each project. This means that the order will be different to the hierarchy but since we are only interested in counts then that’s not a problem.
It will exclude deleted objects, deleted modules and deleted projects. The results are displayed in the DXL interaction window.
Global Metric Count Tool – DXL Interaction window output
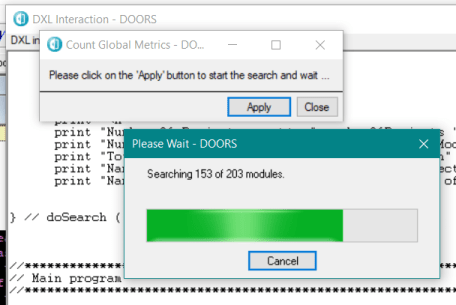
The script opens up every module in the database so it can take a long time. A progress bar is therefore used to display the current position in searching through the database.
Gblobal Metric Count tool – Progress Bar
But perhaps the most significant aspect of this tool is that it can be easily adapted to collect other information as it parses its way through the projects and modules.
It is common to use colours to highlight specific values. This can be undertaken using the inbuilt features of DOORS to colour the text or the background based on the colour of an attribute enumeration. However, this has limitation in that it is sometimes difficult to read the text when in read only, and that only one colour can be used at a time.
The RAG metrics technique (and it is not limited to just Red, Amber and Green) can be used to set the colour of a layout DXL column based on keywords that are contained within the target text attribute. Any number of columns can be set up that will reflect any combination. It is a simple matter of editing the script.
This is a more sophisticated display of a percentage bar for multiple metrics for multiple modules. It uses a specific module that can be located anywhere in a project and that has just two views. There are two DXL scripts associated with this module. One is an attribute DXL script which contains functions to locate the target modules of interest, calculate the metrics and write the values back to the module; the second script contains layout DXL functions to read and parse the value entries and display the results as a list column and as a percentage bar.
Metric View: This view consists of four columns. The first column is a free format description of the metric. It takes no part in the metric determination. The second column displays a box, the percentage value, the actual count and the name for each enumeration to be counted. Note that the percentage total value may not be 100% as the individual values are rounded to the nearest integer and then totalled. The third column displays the same information but as a percentage bar. If the width of this column is changed then the percentage bar is automatically resized. The name of the attribute enumeration is only displayed within the bar if there is sufficient room to show the whole name. The final column displays the date and time when the DXL used to calculate the metrics was last run.
Metrics View
Metric Values: The entries within the columns within this view determine the metric itself. The first column is simply the Object Identifier. The second column, as in the Metric View, is the free format metric description from the Metric View. The next column determines whether the metric should be based on enumeration values in the target module or as a filtered count. The next column contains the full path of the module to be searched. If a project name (rather than a module name) is used, then the script will search all the modules in the project. If this option is selected, then the modules will need to have the same attribute enumerations. If a view name is added into the next column (it is optional and can be left blank), then this view is loaded and if the view has a filter then this constrains the values of the enumerations.
The attribute name column contains the name of the attribute that the enumeration values will be derived from. This is automatically extracted from the target module. The next column identifies the colours to be used for each enumeration. These can be set to any colour from the standard list of real colours. If there are insufficient colours defined, then the enumeration will be displayed as pale blue (which has an integer value of 0).
The next column displays the values from the DXL script that performs the search and calculations. The format is described below. The final column, as the metric view has the date and time of when the script is run.
Metric Values
These are the metrics as run on the Stakeholder Requirements module in the Car Project, with a filtered view “Requirements” applied and the System Requirements module with no view applied.
Note that the values in the Value column have a specific format and should not be changed as the entries are all calculated by the DXL script:
value,colour,B|W:count
value : name of the enumeration colour : the integer value of the colour in the colour map B|W : text colour (Black or White) count : the actual number of counts of the enumeration in the target module(s)
This
utility will collect metrics from multiple modules rather than just a single
one. The modules within a project are displayed and are then selected manually.
The values collected from the modules are displayed in a text box, separated
with tabs.
The
values can be copied directly into an Excel spreadsheet where they can be analysed
and displayed in a graph or pie chart using Excel tools which are ideal for
management summaries.
The Metrics and Status Tool automatically calculates the traceability,
review and verification status of all the requirements for a specific module.
It’s a great way to direct the user to the work required.
Get Metrics Status Tool
The status is represented as a traffic light system. Each of the view buttons apply a predefined filter to the module to only show the requirements with the specific value. For example, the user can select the View button to display the 315 objects that do not have the necessary traceability in place, so that the links can be added.
The values can also be directly exported to Excel using the Save Metrics button where they can be analysed and displayed in a graph or pie chart using Excel tools which are ideal for management summaries.